So, it is essential to keep track of a progress and determine the necessary changes that should be implemented urgently to develop e-commerce business successfully. For this, you need to identify the main eCommerce metrics for your online store that strongly affect results.
As experts in Magento ®, we recommend that you consider the following important metrics and efficiency indicators that can help to analyze the work of your online stores and evaluate the impact of different factors on your e-commerce business.
Website Traffic eCommerce Metrics and Efficiency Indicators
Google analytics can give you all the traffic information about your online store from all sources such as organic search, direct entry, social media, e-mail or referrals. It is important to analyze how many new and return visitors you have every day. Enhancing the rate of traffic is essential, as more users visit your online store – you will have more chances to convert them into buyers.
There are many factors influencing this indicator. First, try to use unpaid methods or internal optimization to positively influence eCommerce metrics. Examples might include, content quality improvements, new web design, technical enhancements and so on. Paid methods can include print ads, display ads, all types of shopping engines, Google ads and so on.
Cost of Acquiring Customer (CAC)
It is obvious that you should attract visitors and then convert them into real clients. In most cases, it costs some money to run marketing campaigns and other activities. CAC indicators discover these costs. The lower CAC is – the more effective your e-commerce business will be. Further, we will review the tools you can use to determine which channels are more efficient.
Repeat Customer Rate (RCR)
To attract a new customer is more expensive than to hold the existing one. RCR is the percentage of clients that come back to your online store to buy again. The more loyal customers are in the online store the more profitable business can be. In your Magento ® Admin Panel, you can generate a report of how many customers have repeated purchases.
Abandoned Cart Rate
It is the percentage of visitors who add something to the cart but don’t complete the purchase. It is not so difficult to calculate this indicator. Magento ® admin panel gives you a very precise report about all your abandoned carts. The main problem is to analyze why it happened. There are many reasons that cause this problem, but in any case, we recommend checking the checkout procedure.
Our company provides GoMageLightCheckout: One Step Checkout extension for Magento ® and from our experience, we know that it is the most significant phase of the purchasing process.
Conversion Rate (CR)
CR is the percentage of visitors to your online store who made a purchase. To have a maximum conversion rate is the main purpose of each online store owner. Most probably, each merchant knows the average percentage of conversion rate. But it is possible to analyze CR in more details using Google Analytics.
The Conversions area demonstrates to you the way of your visitors through your online store. Conversions reports are divided into 4 segments.
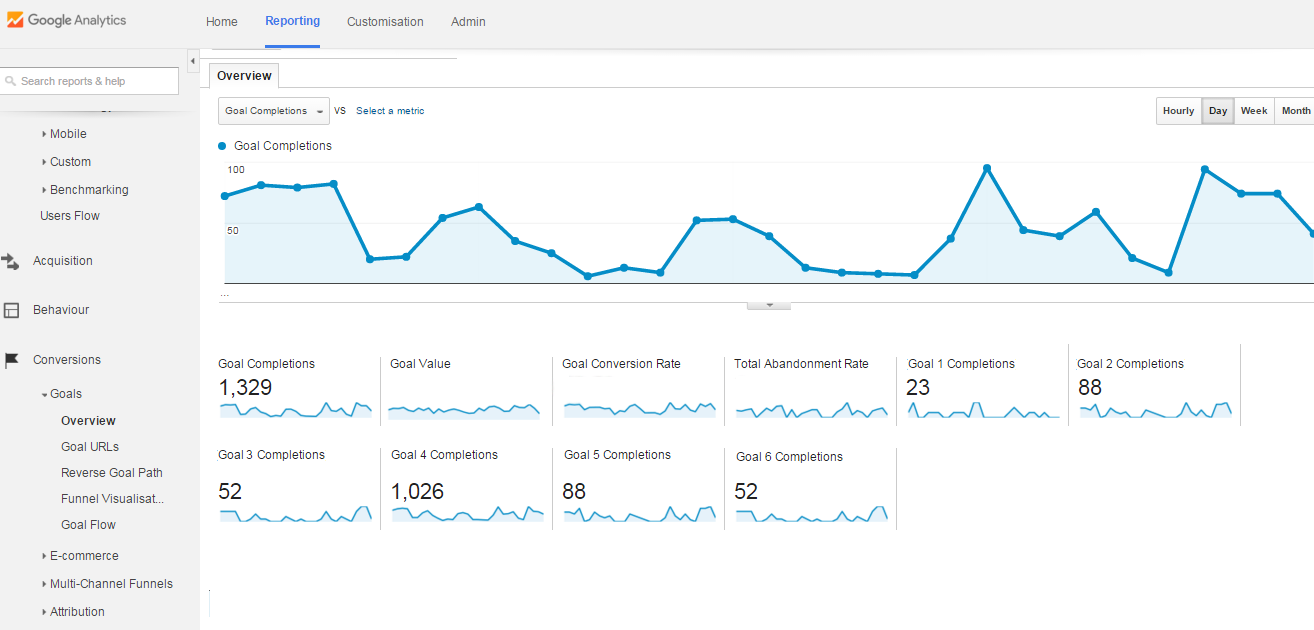
eCommerce Metrics Goals
In this area, you can see the total number of achieved goals in your online store. The goal is the completed action of a client. It may be subscription, writing reviews, adding a product to cart and other activities which are important and can contribute to the efficiency of the online store. Merchants determine what the goals they set for their store will be.
It is possible to analyze all pages where goals were completed or research the Source/Medium area to understand where the traffic originated from. The Goal URLs area displays the URLs in your online store where customers convert. To understand what pages of your online store bring the most conversions, you can choose the Secondary Dimension and select Goal Previous Step – 1. The goal URL area will demonstrate the page a customer visited before landing on the Destination URL.
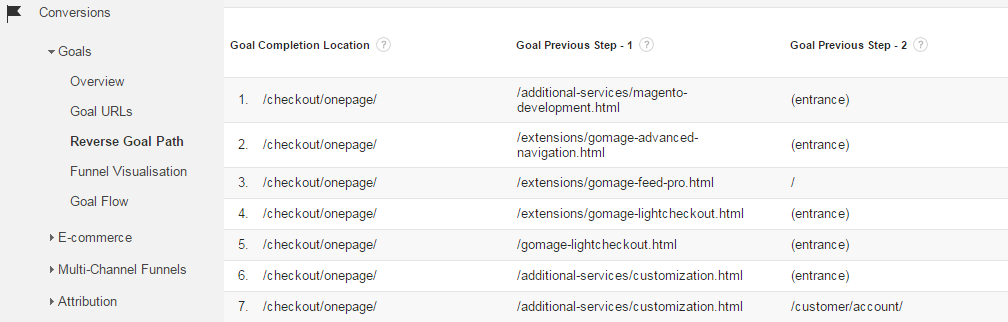
The Reverse Goal Path area shows up to 4 steps on the way to completing the goal. For example, the image below demonstrates that some customers entered the site and before the goal was completed, they visited different pages such as GoMage LightCheckout, Feed Pro, Advanced Navigation.
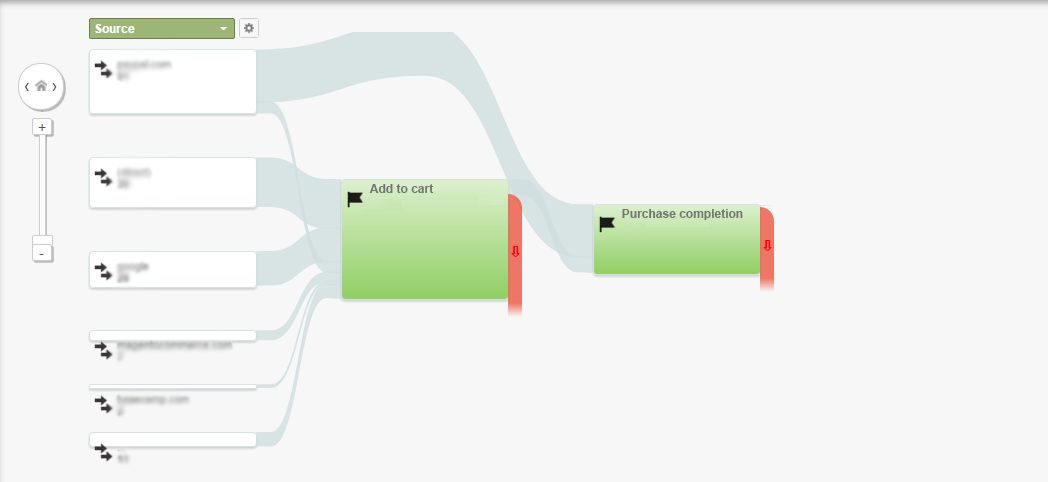
The Funnel Visualization and the Goal Flow Visualization show the goal completion ways of clients in a flowchart.
E-commerce
E-commerce area gives you an understanding of your customers’ path from entry to conversion. The main difference from the Goal area is that only sales results are considered here. You should set up e-commerce tracking to be able to use these reports.
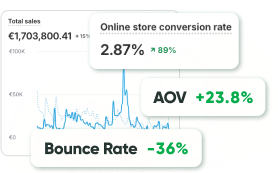
The E-commerce area shows your e-commerce conversion rate, revenue, average order value, unique purchases and the quantity of the product items that were sold. Here you can analyze the information about your main revenue sources – product SKUs, product categories and traffic sources.
You can also set up Enhanced E-commerce by using special e-commerce tracking codes. This area gives you ten e-commerce reports that provide deeper analysis of your customers’ behavior analysis.
Multi-Channel Funnels
Most of the merchants omit this functionality of Google analytics, but it can give some of the most comprehensive analysis of your customers’ goal completing processes. The Multi-Channel area gives you a full report on each channel that works to attract and convert clients to your online store. For instance, a visitor can find your website through organic search. In a few days, the same user can come back using the URL on Facebook. Finally, the purchase is made by this user who visits your site directly.
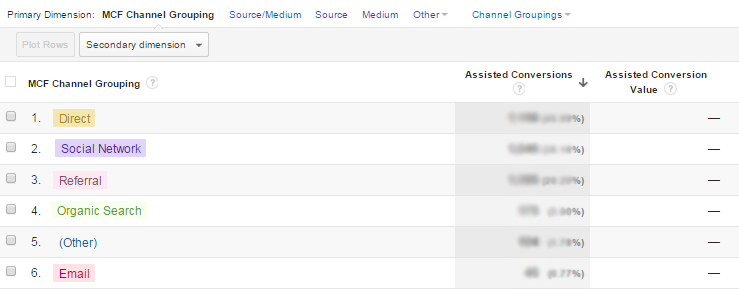
Assisted Conversions
Assisted Conversions area can discover the channels that take place in the conversion path, but do not become the final conversion step.
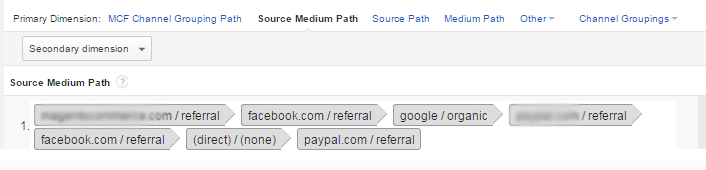
The Top Conversion Paths area demonstrates the paths followed by clients who convert. On the image below you can see that one customer entered the online store several times through organic Google search, URLs on other sites, direct entry and URLs on Facebook and the final step before purchase (in this case, the purchase is the goal/conversion) was the direct entry to the online store. It is very important to analyze the Assisted Conversions because only in such a way can you see the channel that works effectively and gives you real customers.
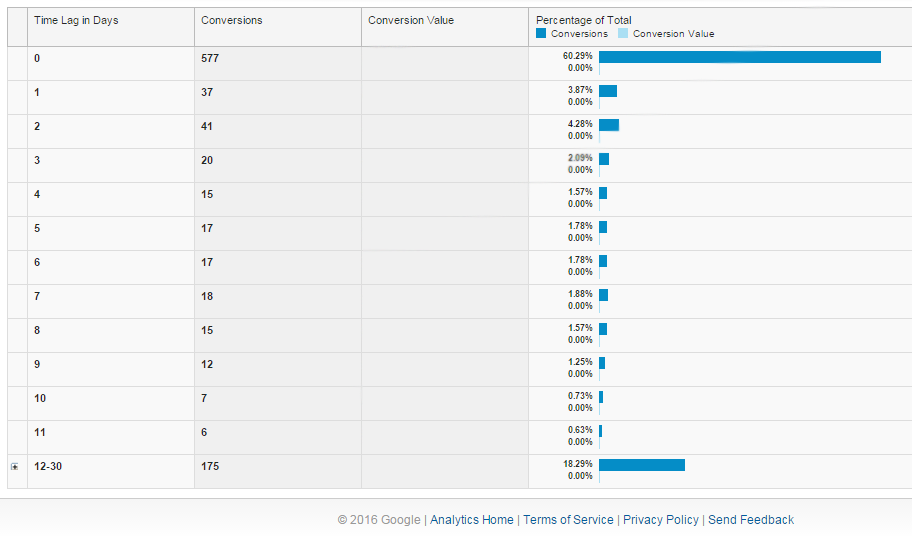
And in the Time Lag area you can track the statistics by days from the first visit to conversion. The maximum length of the period for which statistics are collected is 90 days.
Any metrics can be both useful and useless, and individual businesses may have their own individual efficiency indicators. We have reviewed some of the eCommerce metrics which you can get for free using available online services. We share this information because our experience shows that many merchants do not use all the possibilities to analyze the effectiveness of the store.